
Like many others this past year, I stumbled on the impressive set of TLC Trip Data and took my turn at checking where the NYC cabs like to hang out. I planned to find the best spots for cabs to pick people up at different times of the day in orer to maximize their hourly income. I will explain here how and show you some plots, you can find code and more images in my github repo.
These datasets are big. They encompass all the taxi rides from Jan 2009 to Dec 2015. For each month there are O(10^7) rides for which one gets pickup coordinates and datetime, dropoff coordinates and datetime, trip distance, passenger count, total amount paid split in categories, payment method and probably something else I am forgetting now. The files' size oscillates between 1.8-2.0 Gb per month.
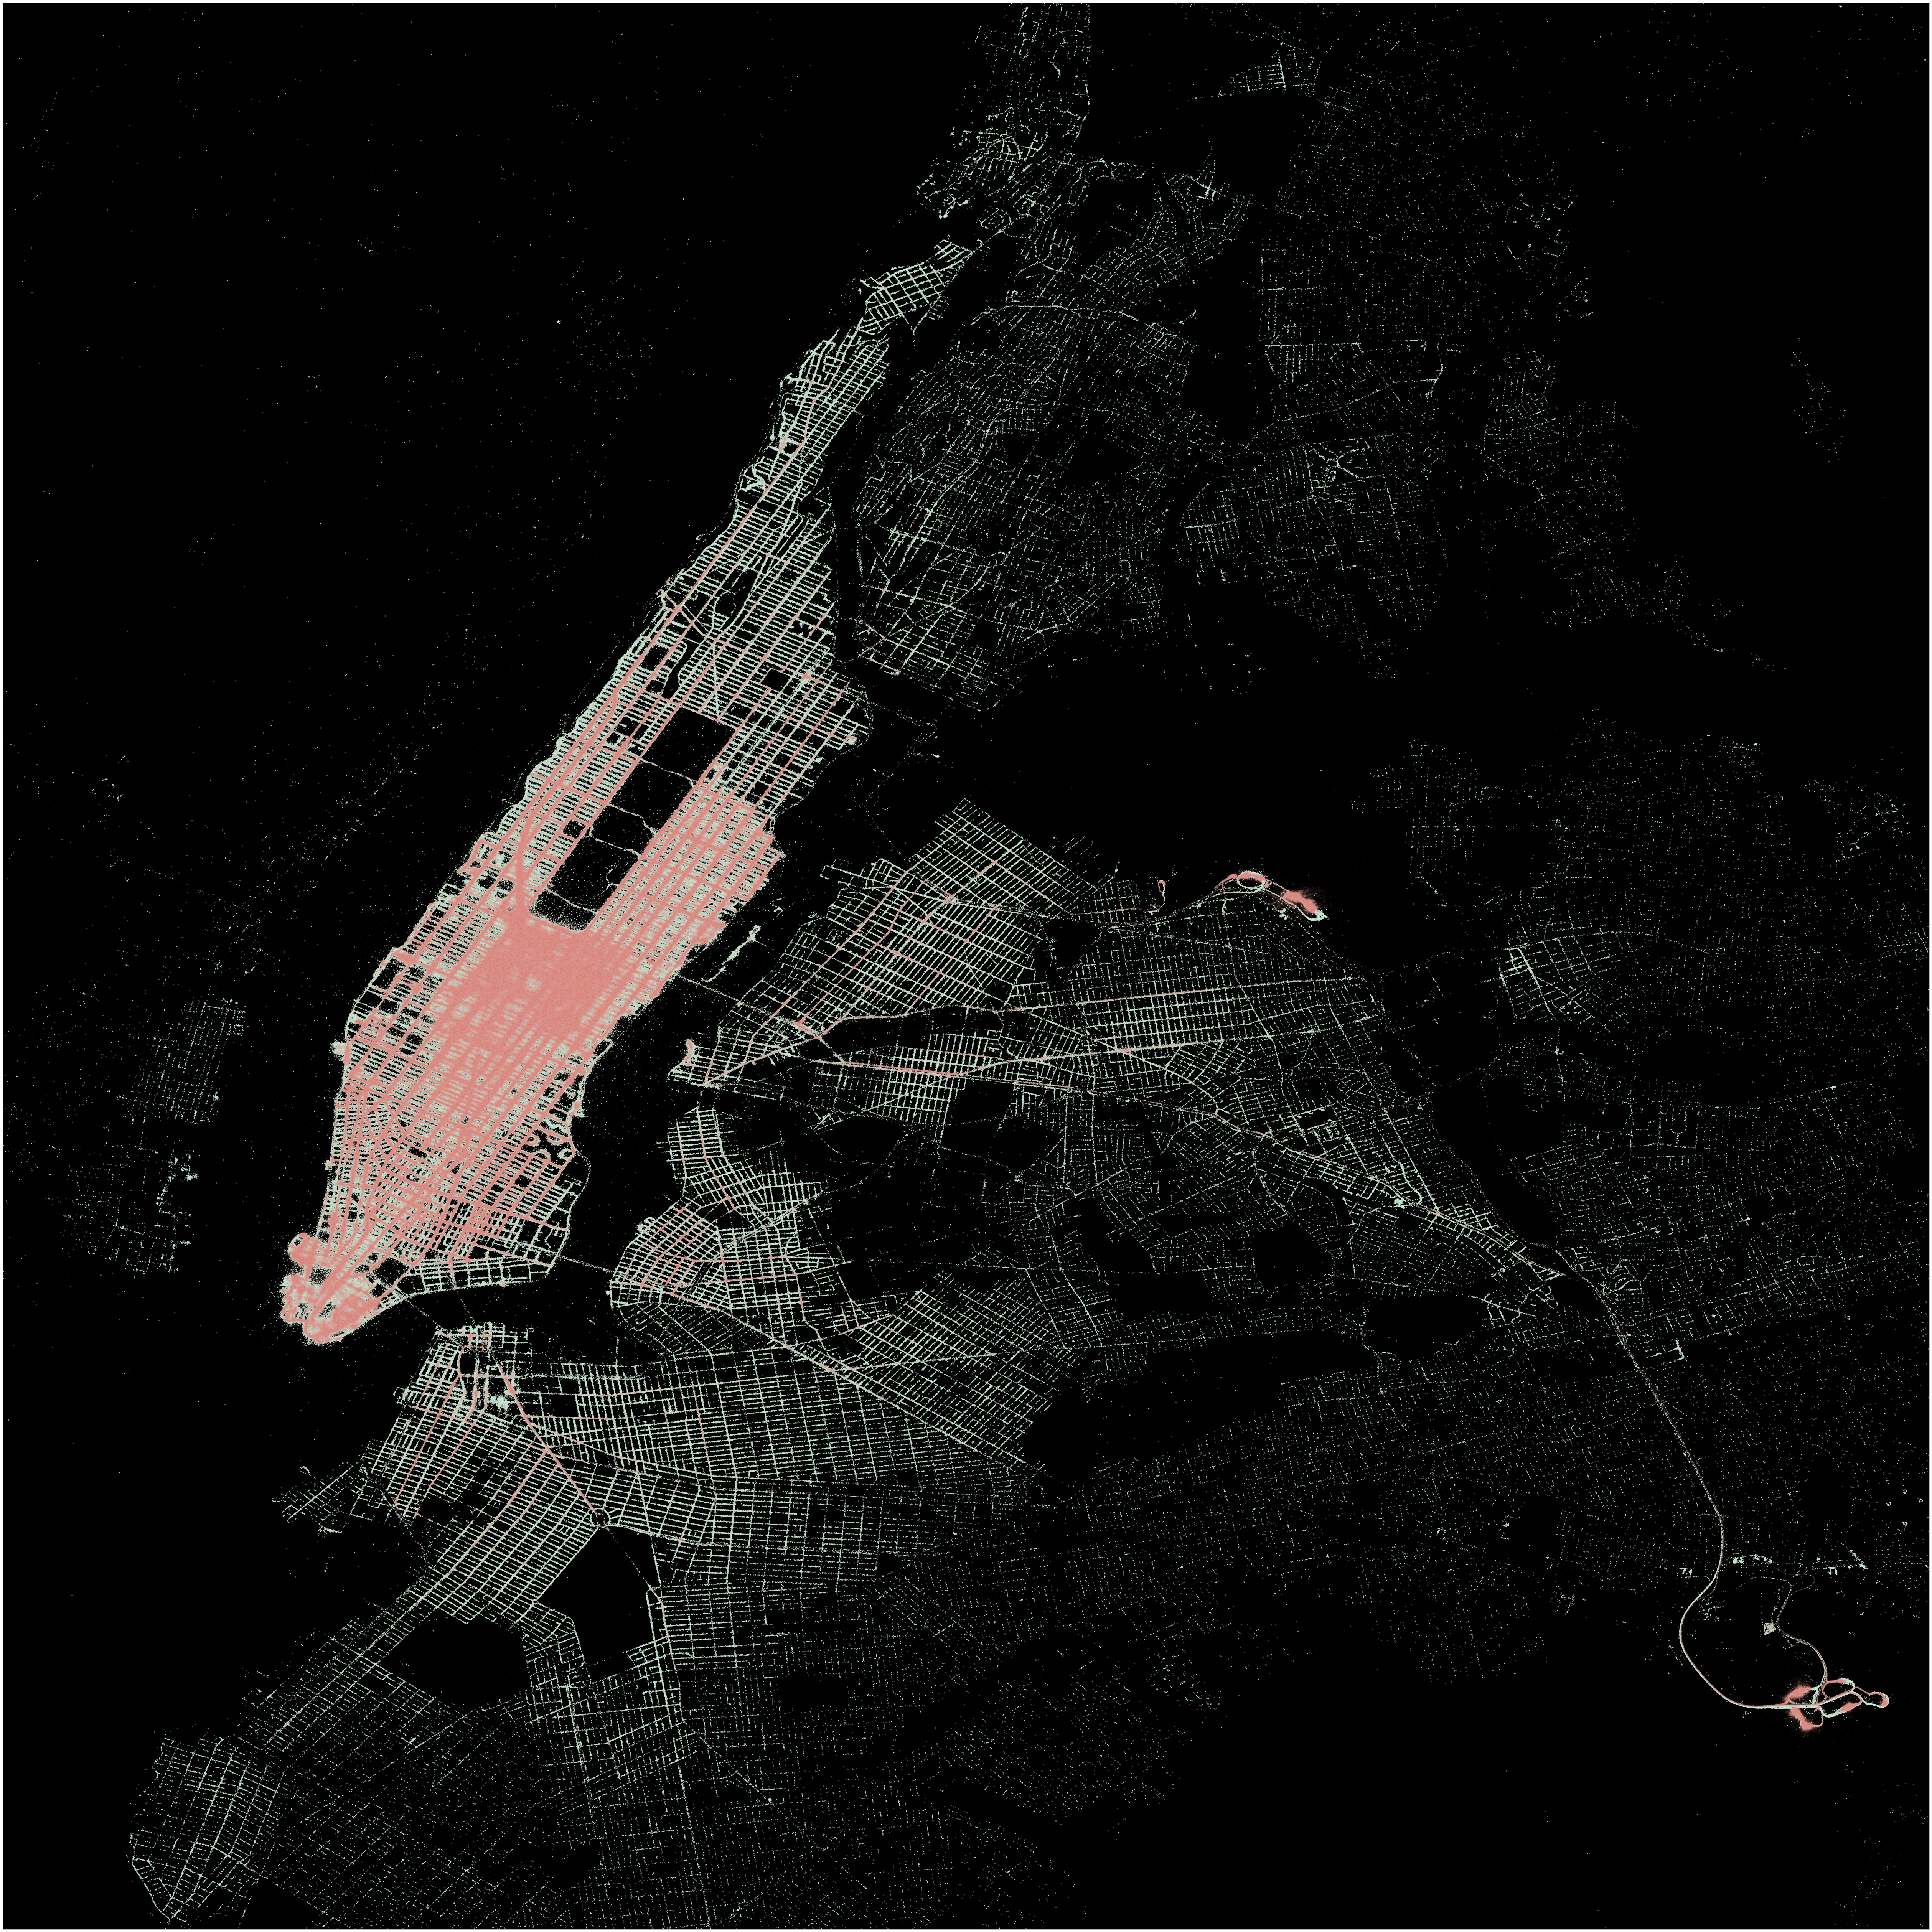
First of all, I downloaded Jan 2015 (literally the first file you see on the website) and here is a cool map of New York City drawn by scatter plotting pickup (in red) and dropoff (green) locations for the whole month.
If you played with this dataset (or with any dataset at all) you know that it needs some cleaning. There appear to be a staggering number of cabs picking people up at the North Pole or traveling at over 1000 miles/h on average. Some even arrive before leaving.
These are easily taken care of, but what surprised me was that lots of people do not seem to tip: have I been an idiot all this time? The set of customers is divided clearly in tippers and non-tippers, which correspond almost 1 to 1 to card payers and cash payers. I am guessing that inserting the tip in the records when paid in cash is an extra mile that cab drivers are not willing to go for the sake of data collecting.
I populated the tip column with a linear model based on the card payers and the data was pretty much good to go for further analysis.
Now, how to assign value to a cab ride? Easiest answer: (total fare) / (ride duration). The problem with this first approximation is that it does not take into account the time that cabs spend finding new customers, i.e. not making money. Still I could not track every single cab to compute the non-paid time with this dataset.
Luckily some old data has the info needed to track each single taxi. I dowloaded the first set that you find there, i.e. Jan 2013, and that is the base for all that follows.
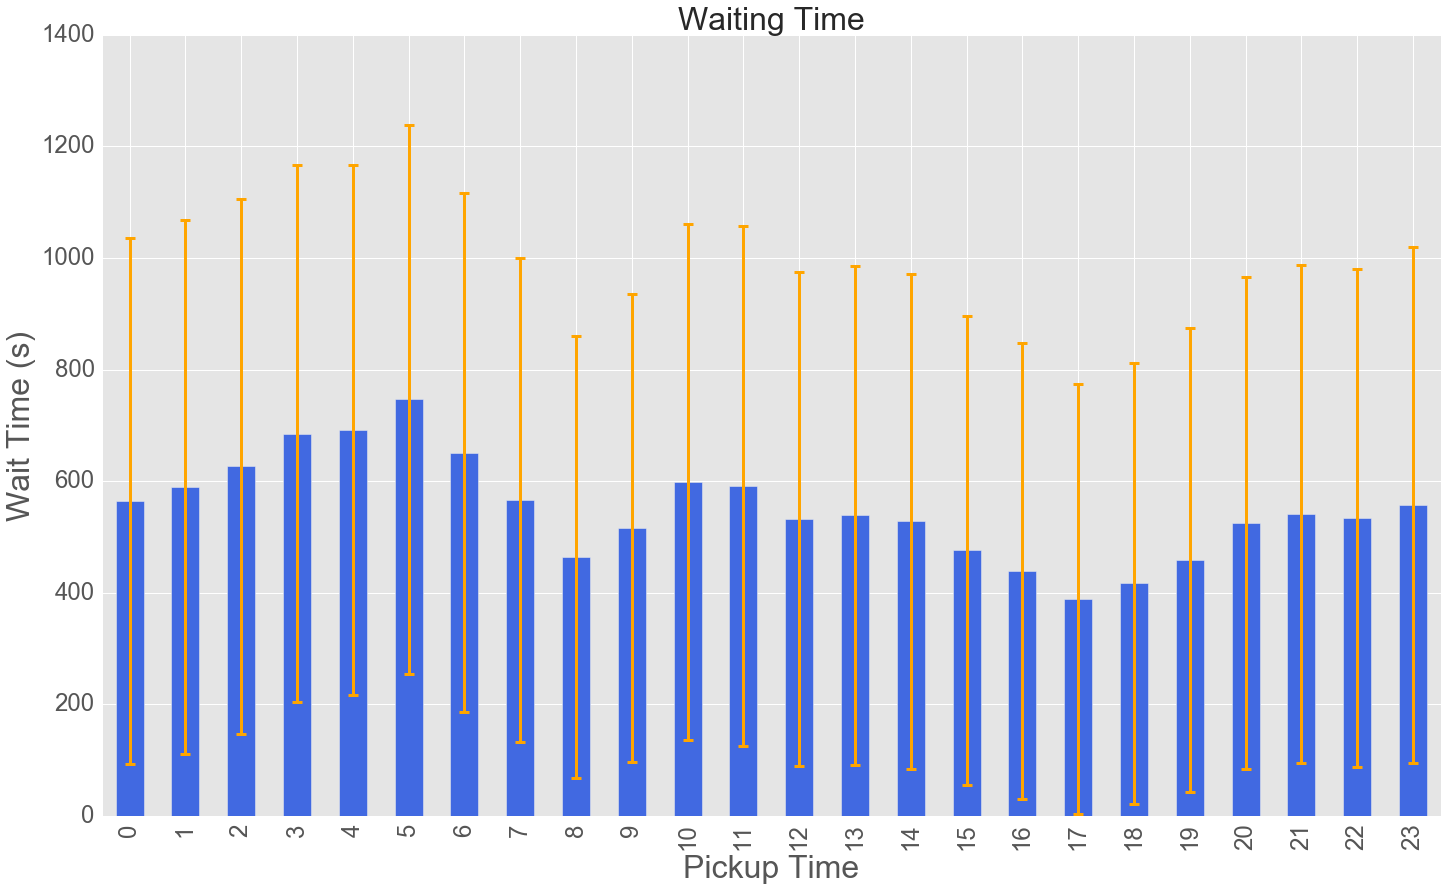
After combining and cleaneing this dataset as well, I computed the wait between two clients, here as average per hour of the day. Notice the gigantic variance even after I took care of cabs that are out of service.
Going on, I defined the trip value as:
trip value = (total fare) / (time waited + trip duration)
and plotted it against hour of the day and day of the month (weekends and holidays and holidays in red).
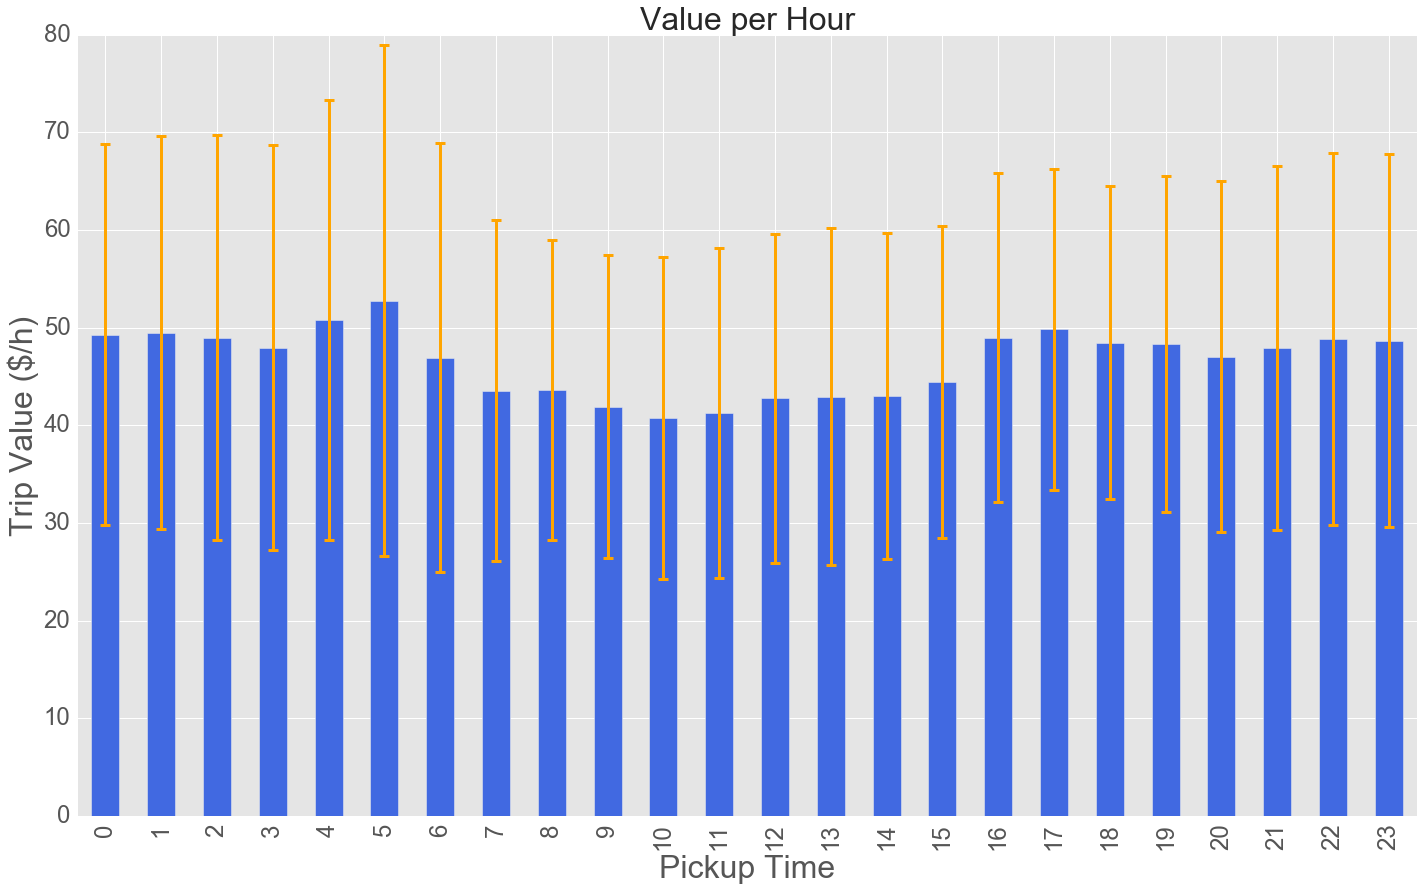
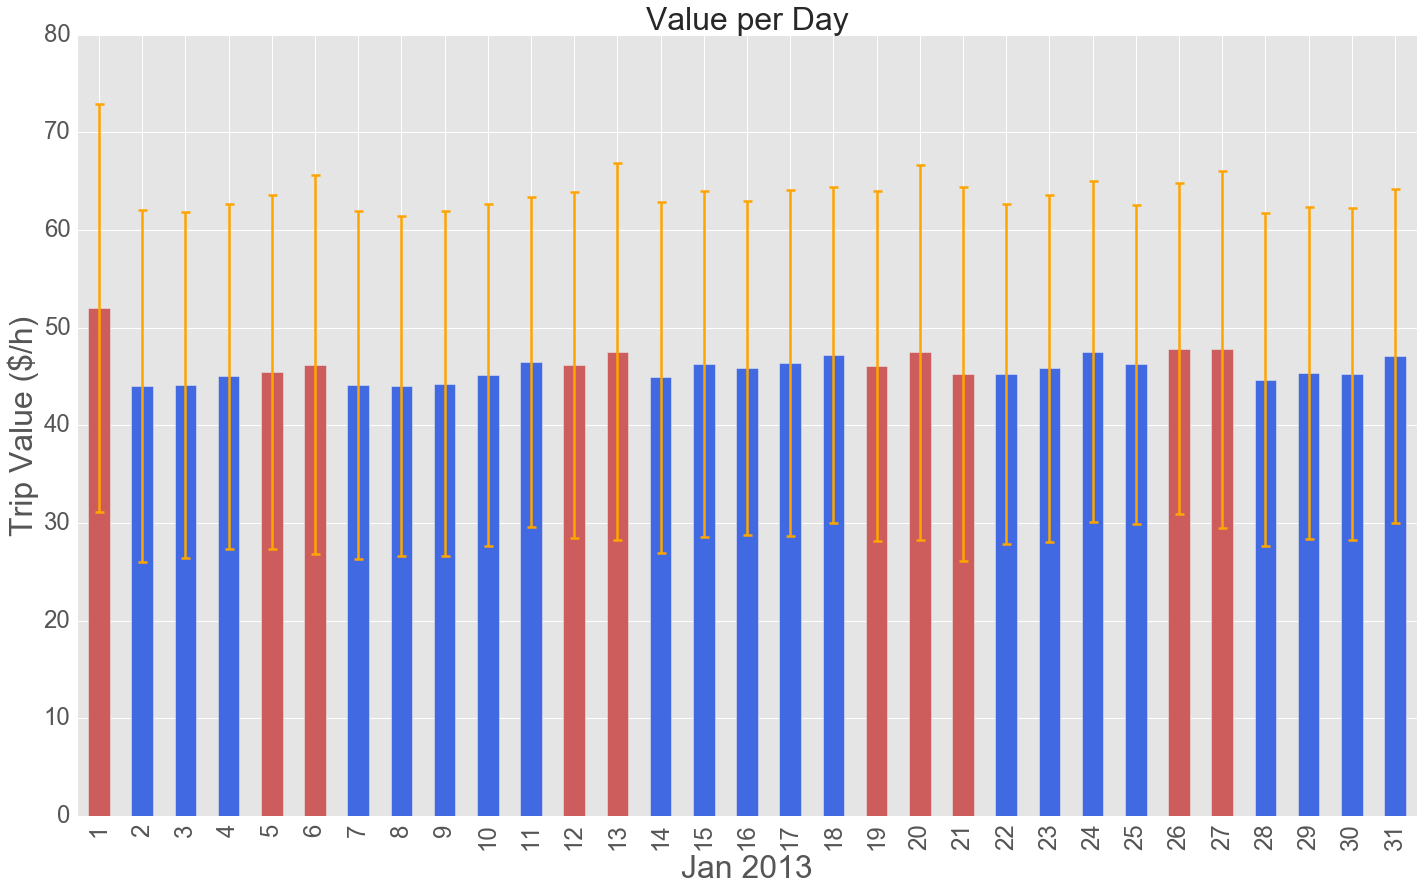
The few cabs out at 5am are doing well (maybe because no one else is around) and then there is a peak after work. From the day of the month barplot we can easily infer that drunk folks like to take cabs after new year's eve celebrations. Also, the drivers seem to make increasingly more $/h as the week progresses.
Finally, here is a panel with maps (you might want to enlarge it, but a blownup example is below). For each hour of the day the data is pixeled in location and the maps are colored according to the average trip value in each pixel. Pixels with too few cab pickups are discarded: there might be some very valuable trip, but still it is not advisable to drive a particular area if there are just a couple of pickups a month.
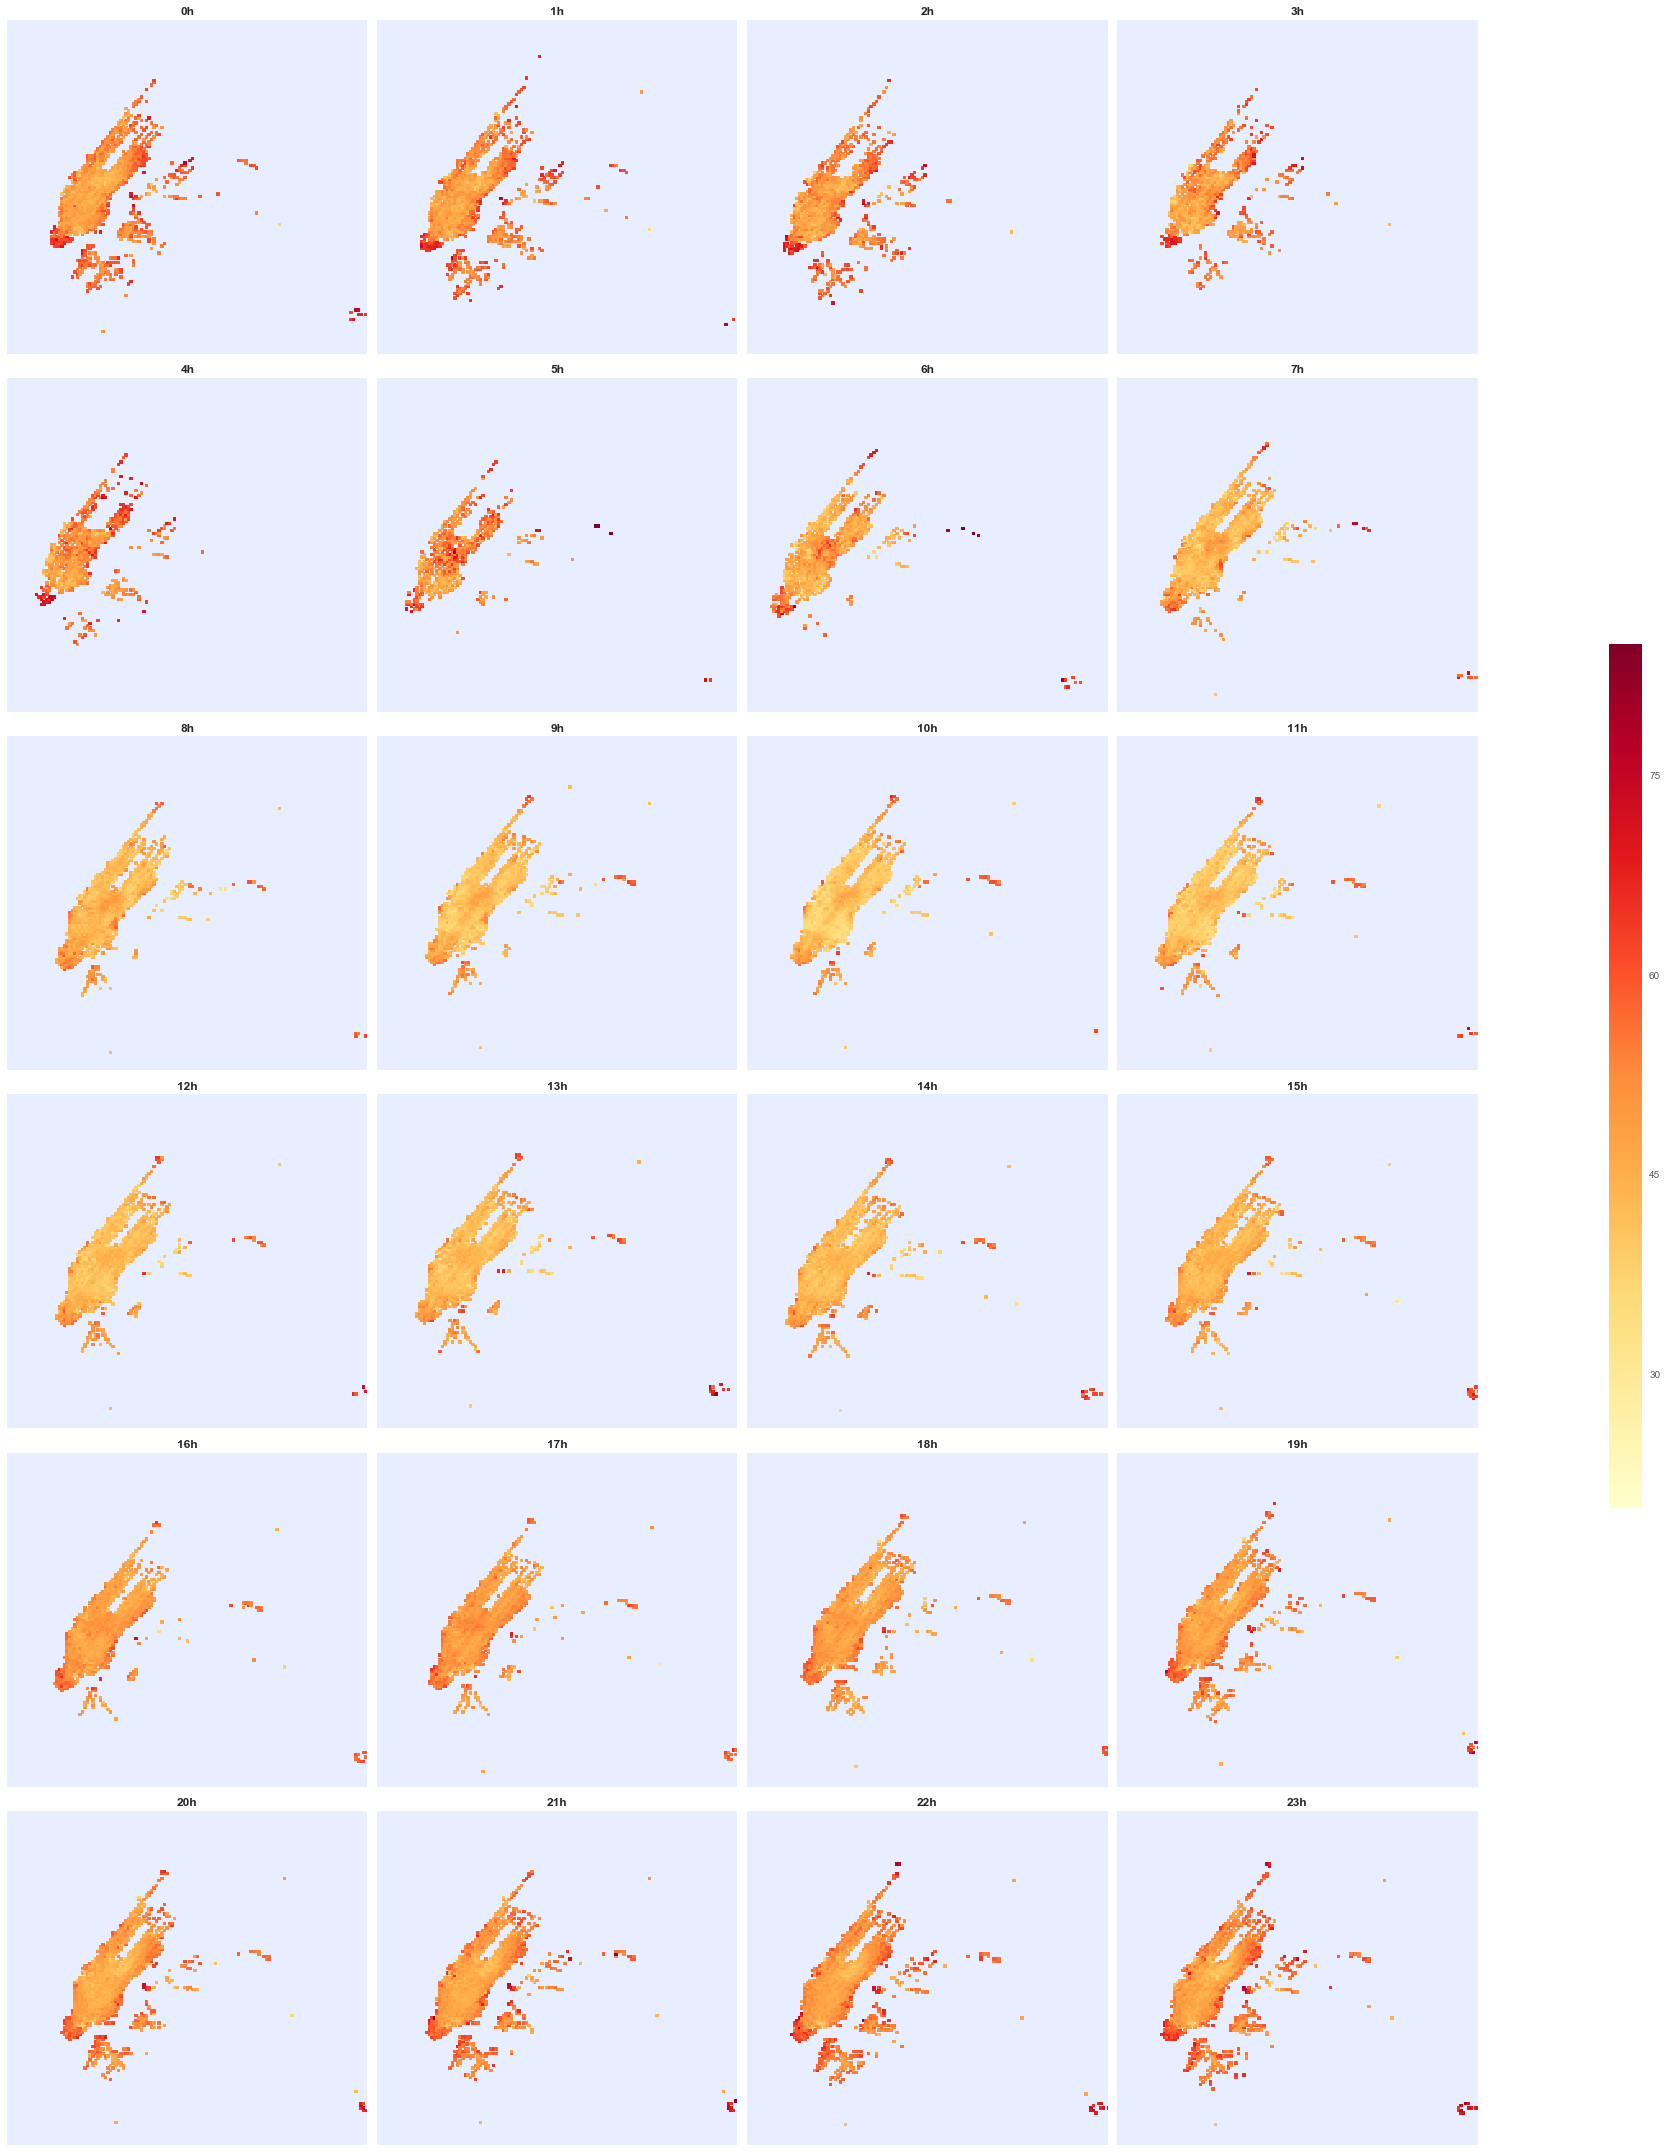
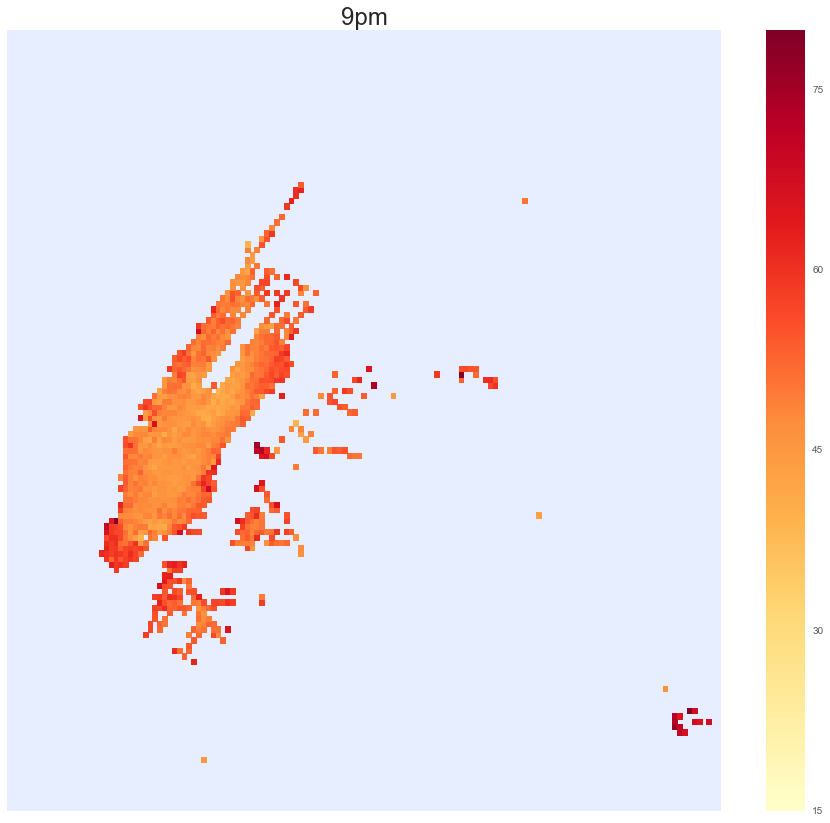
As seen above, the middle of the day is not great, but downtown is consistently the best spot. One can also locate JFK and La Guardia airports: they are not necessarily the best spot in town, but they are a sure catch (as expected): the waiting involved probably takes down the trip value even if the total fare is high. Here is a blownup map for 9pm.
Lastly, I checked what parameters matter the most in determining the value of each trip (duration and total fare apart, of course). I trained a random forest and here is the result.
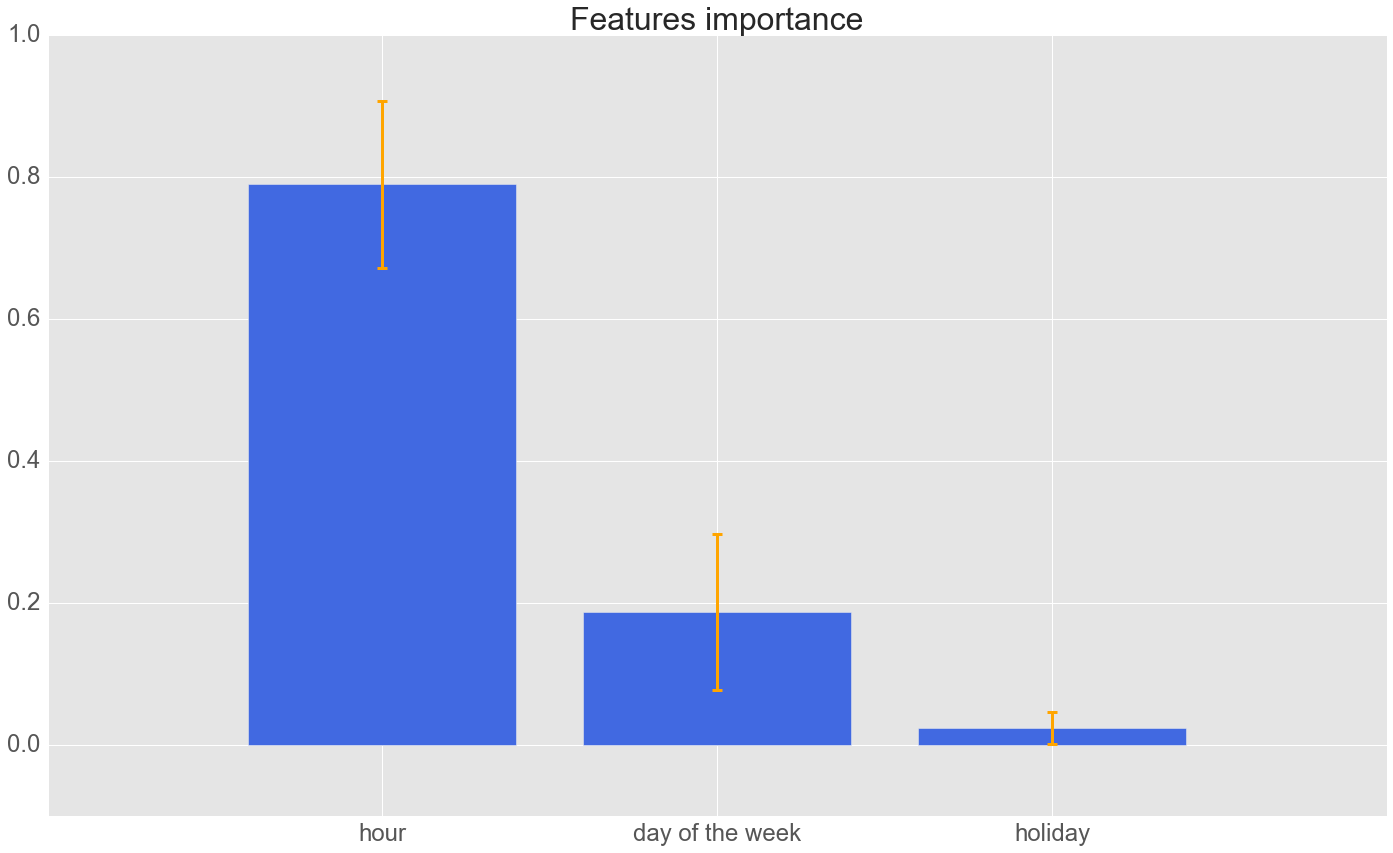
It turns out that cabs make more or less the same money whether it is holiday or not and what matters most is the hour of the day they are out working.
Location is missing but I am planning to classify the rides by neighborhood. The panel above clearly shows that different neighborhoods will yield different trip values. The most straighforward endgame for this study would be an app that advises cab drivers on where to drive in order to maximize the dollars per hour, given features and location.
Nevertheless, the obvious next step is to include more than one month worth of data. One month is pretty much all my 8Gb RAM macbook pro can take, but thankfully cloud computing is cheap and easily accessible.
People have been using these data to implement really cool visualizations and answer pressing questions like is Die Hard a realistic movie?. Yet, I believe there is still a lot of useful projects that could be developed thanks to these datasets. Maximizing cab drivers income is a great possibility, but the real challenge would be to understand what changes our city could implement to make traffic more efficient and all our lives better.
Go Top
comments powered by Disqus